34. Error Reporting Guide for Developers
34.1. Overview
This document outlines the standard process for reporting errors encountered in the d3VIEW application. Proper error reporting helps developers quickly identify, reproduce, and fix issues.
34.2. Console Errors (console.log / console errors)
Steps to Capture:
- Open the application in your browser.
- Right-click anywhere on the page and select Inspect.
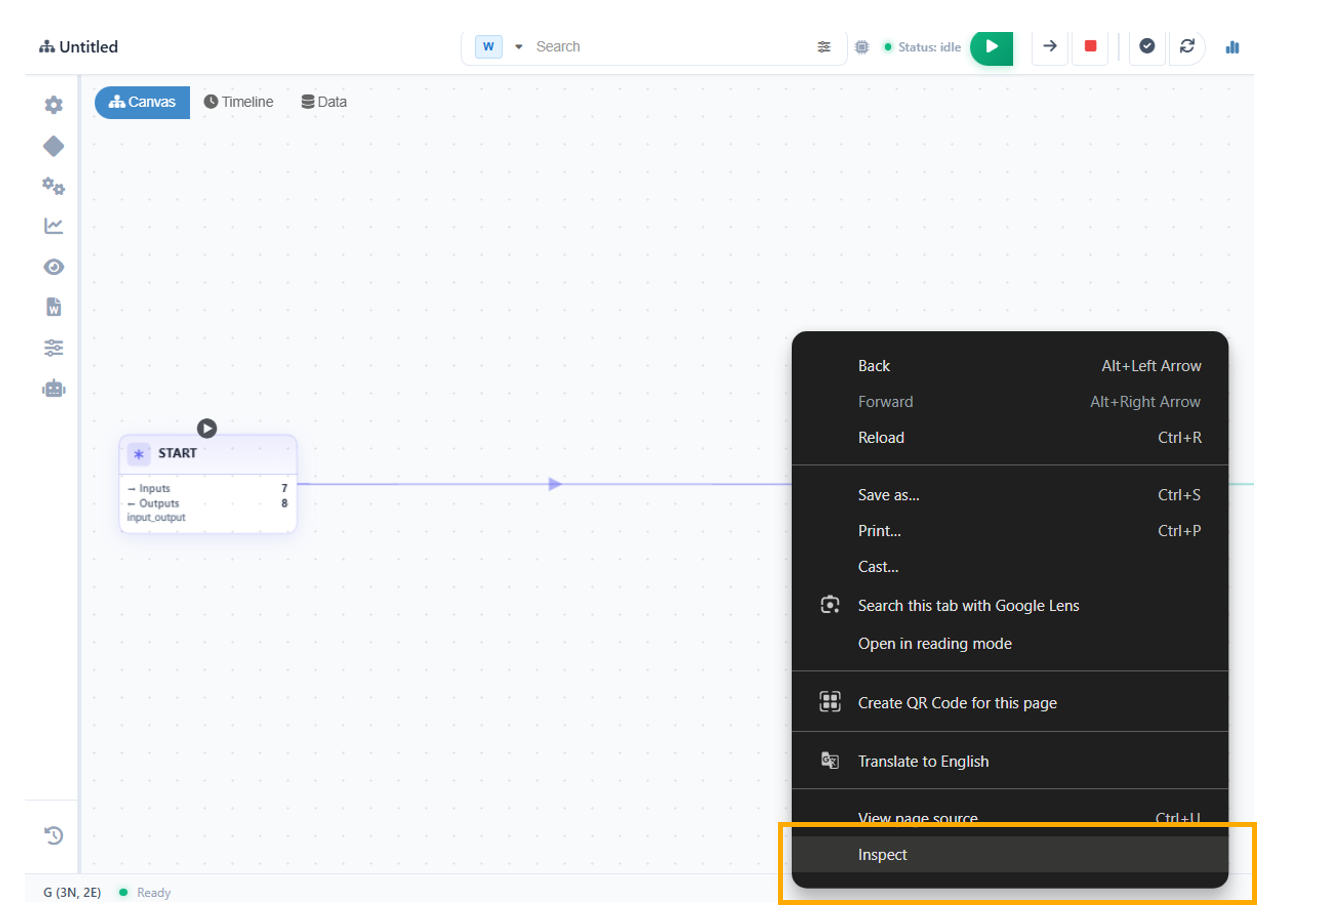
Inspect
- Navigate to the Console tab.
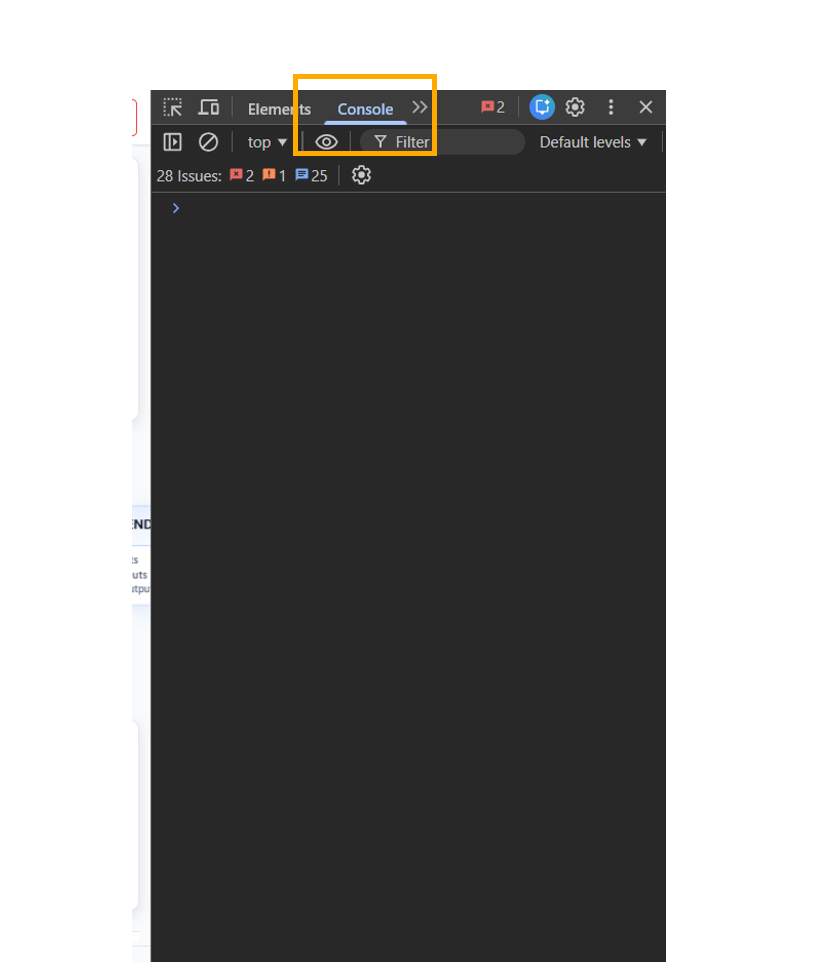
Console log
- Reproduce the issue.
- Look for:
- Errors (red messages)
- Warnings (yellow messages)
- Relevant logs (console.log outputs)
What to Capture:
- Screenshot of the console
- Exact error message
- Stack trace (if available)
Example:
TypeError: Cannot read property 'data' of undefined
    at fetchData (app.js:45)
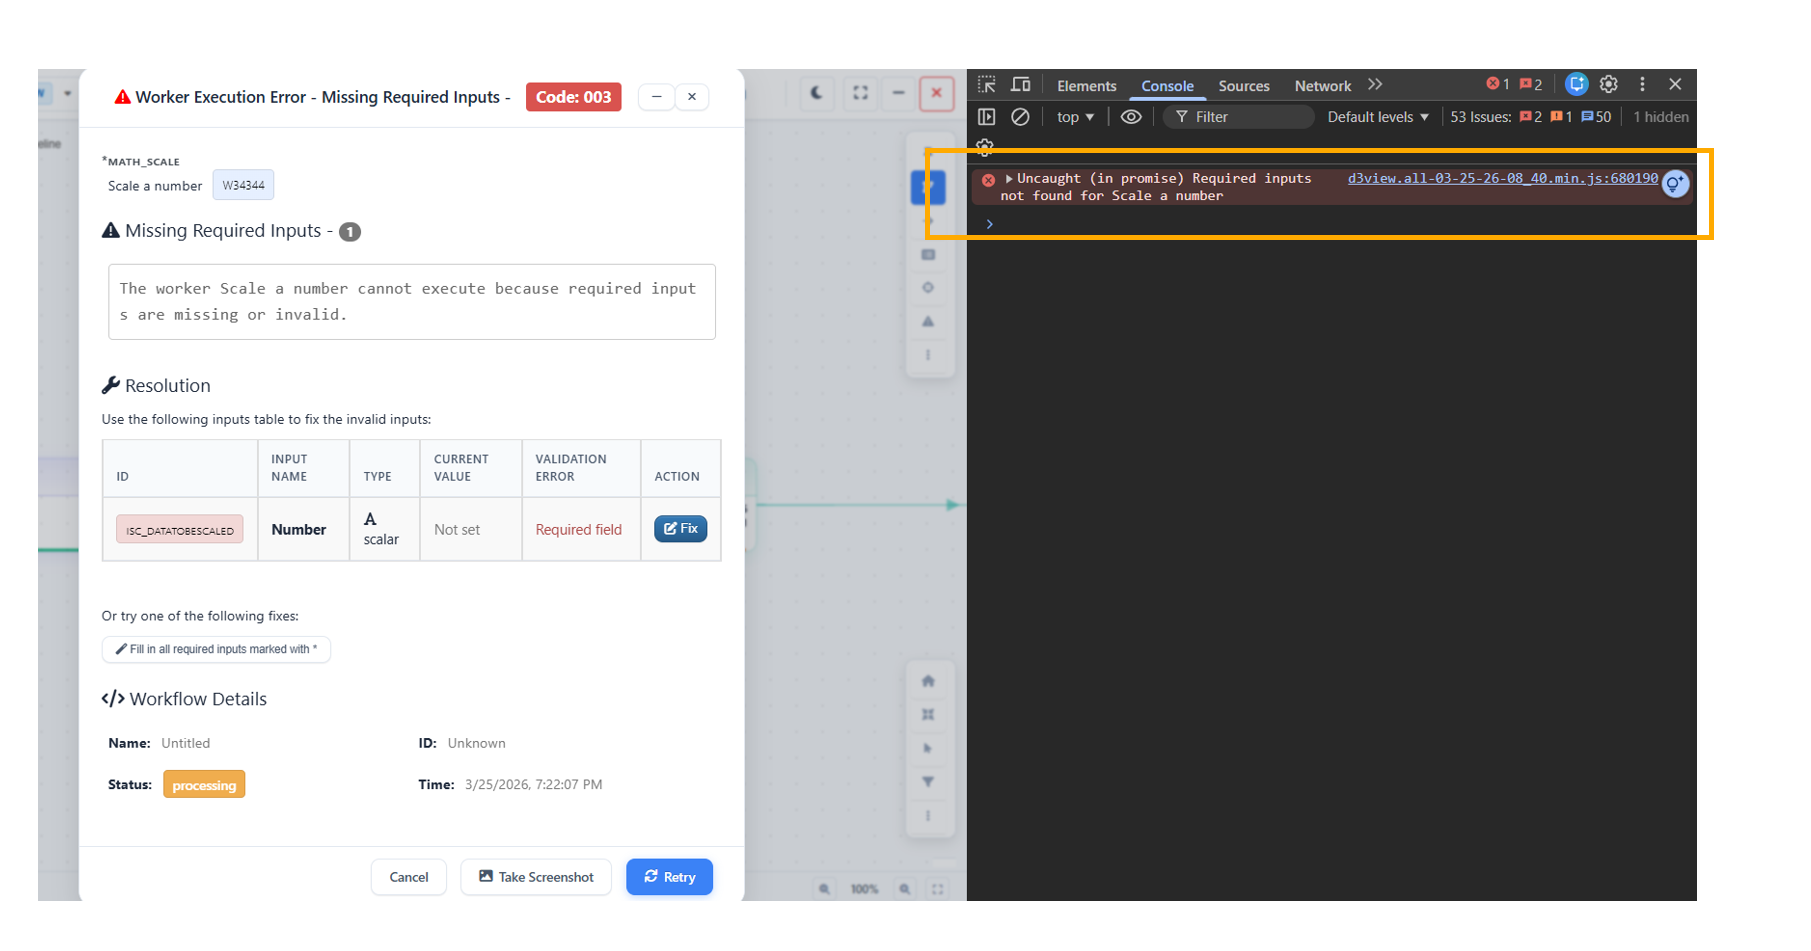
Console log Error
34.3. Network Payload
Steps to Capture:
- Open Developer Tools.
- Go to the Network tab.
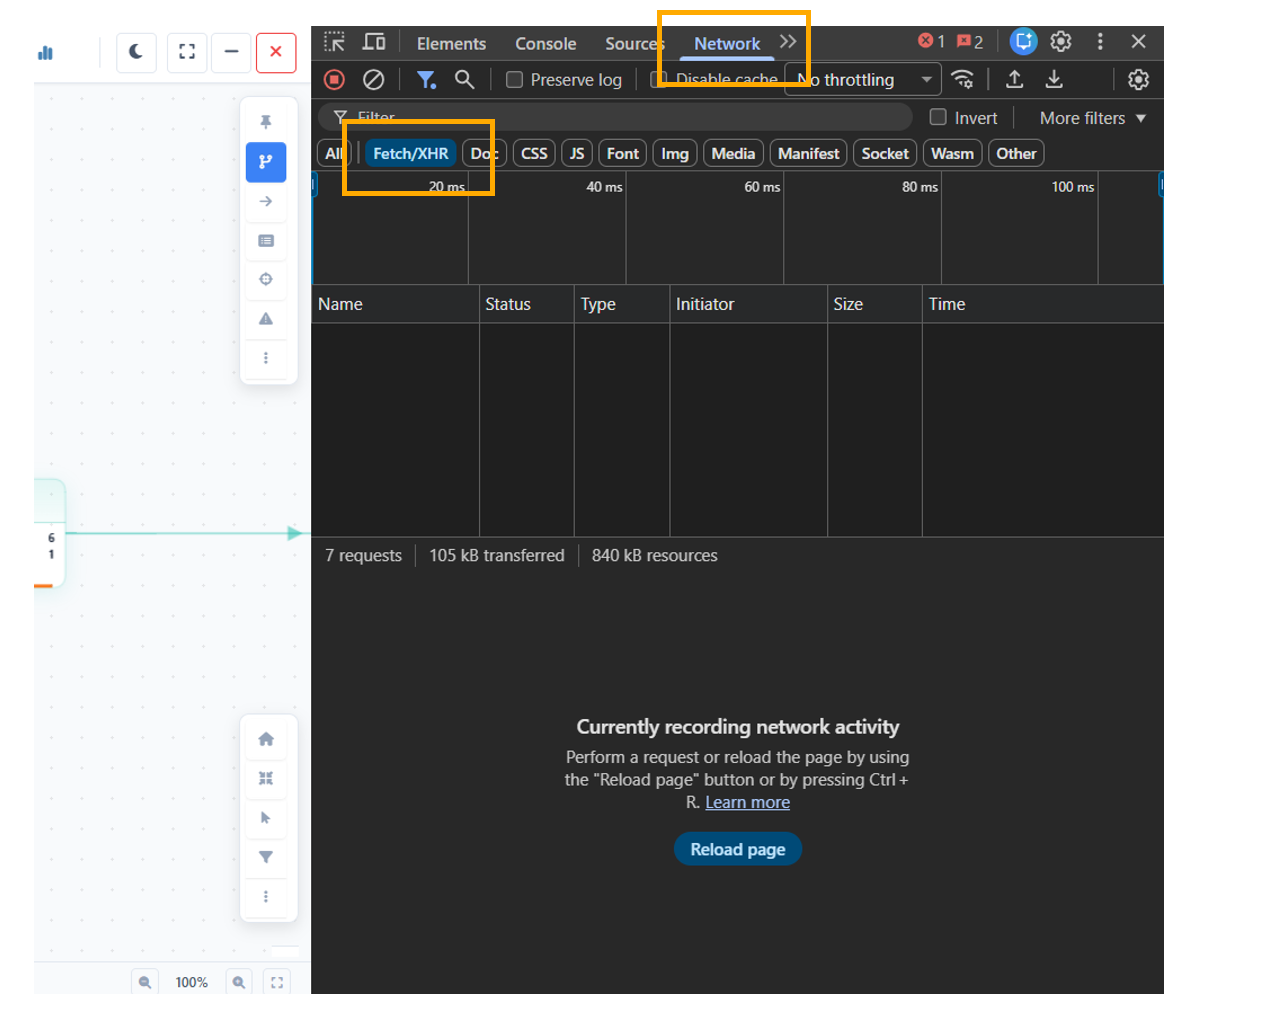
Network
- Refresh the page or trigger the action causing the issue.
- Filter requests using:
- XHR / Fetch
- Select the relevant request.
- Go to the Payload tab.
What to Capture:
- Request URL
- Request method (GET, POST, etc.)
- Request payload/body
- Headers (if relevant)
Example:
{
  "name": "John",
  "email": "john@example.com"
}
Example :
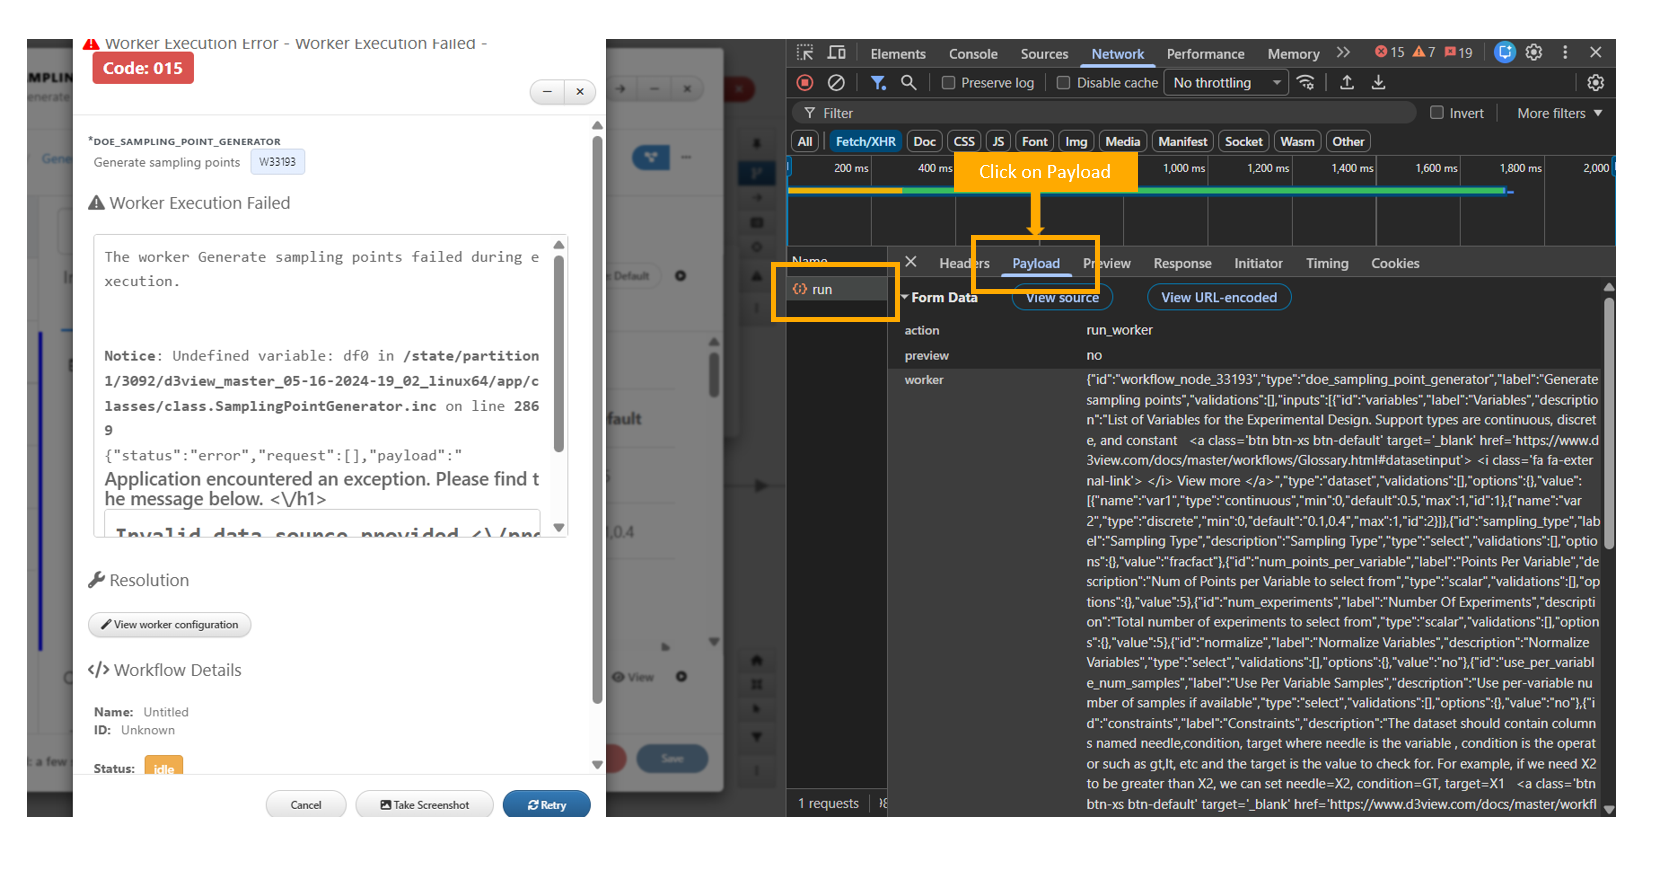
Payload
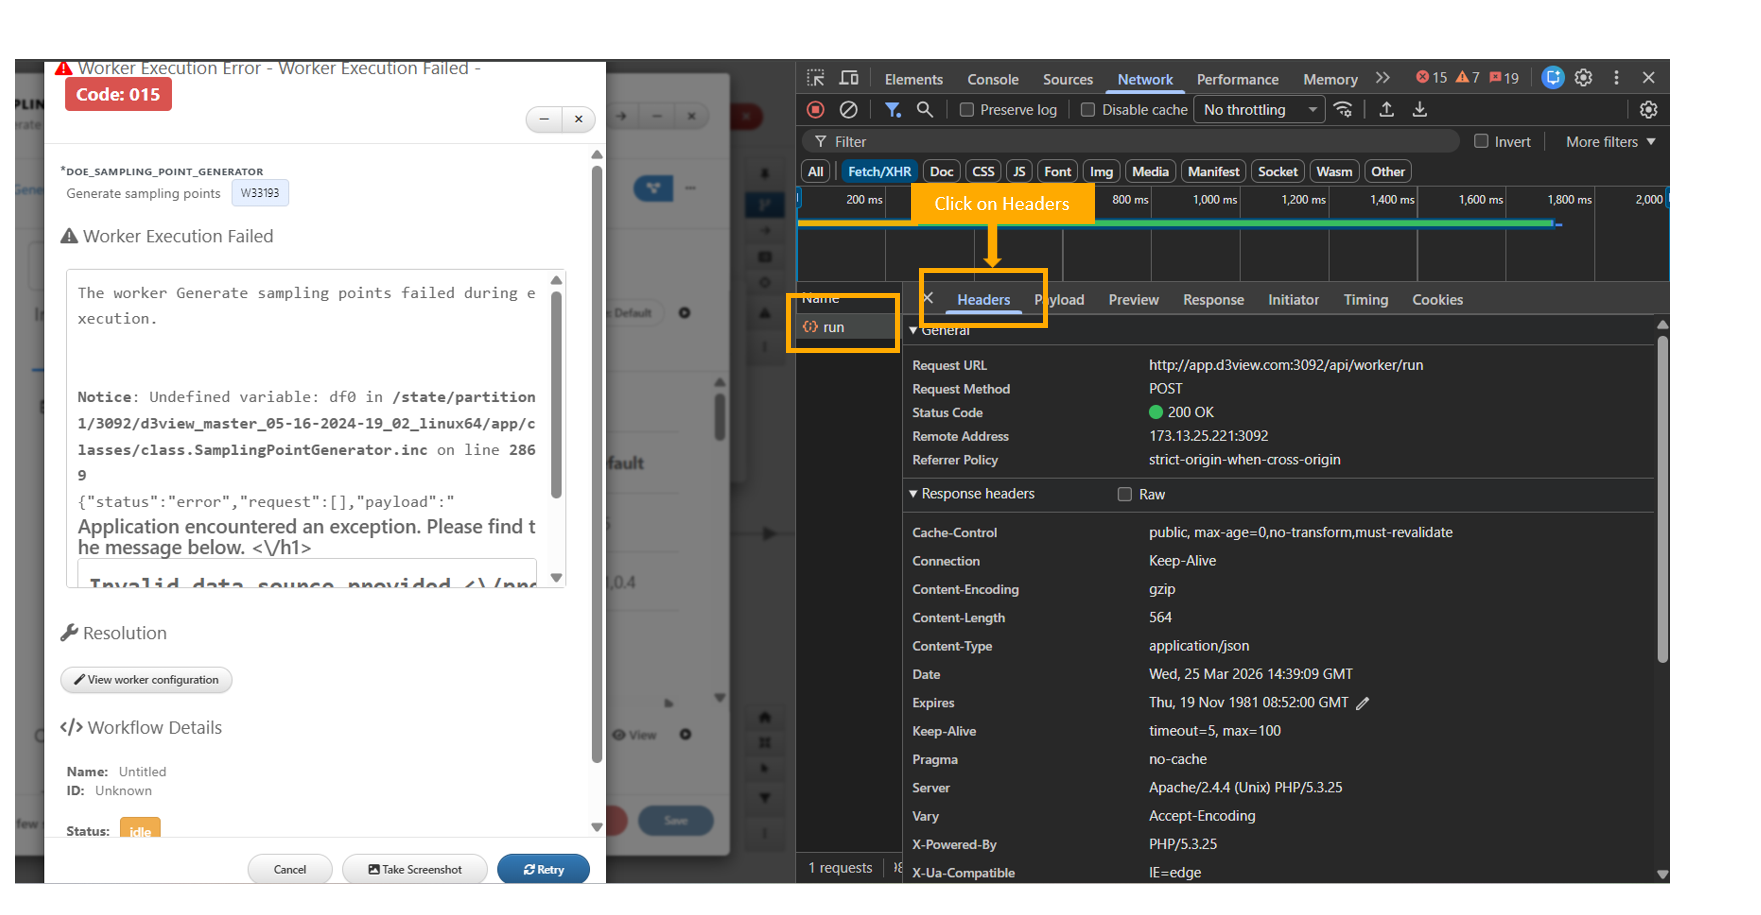
Header
34.4. Network Response
Steps to Capture:
- In the same Network request,
- Navigate to the Response tab.
What to Capture:
- Response status code (e.g., 200, 400, 500)
- Response body
- Error message from backend (if any)
Example:
{
  "error": "Database connection failed"
}
Example:
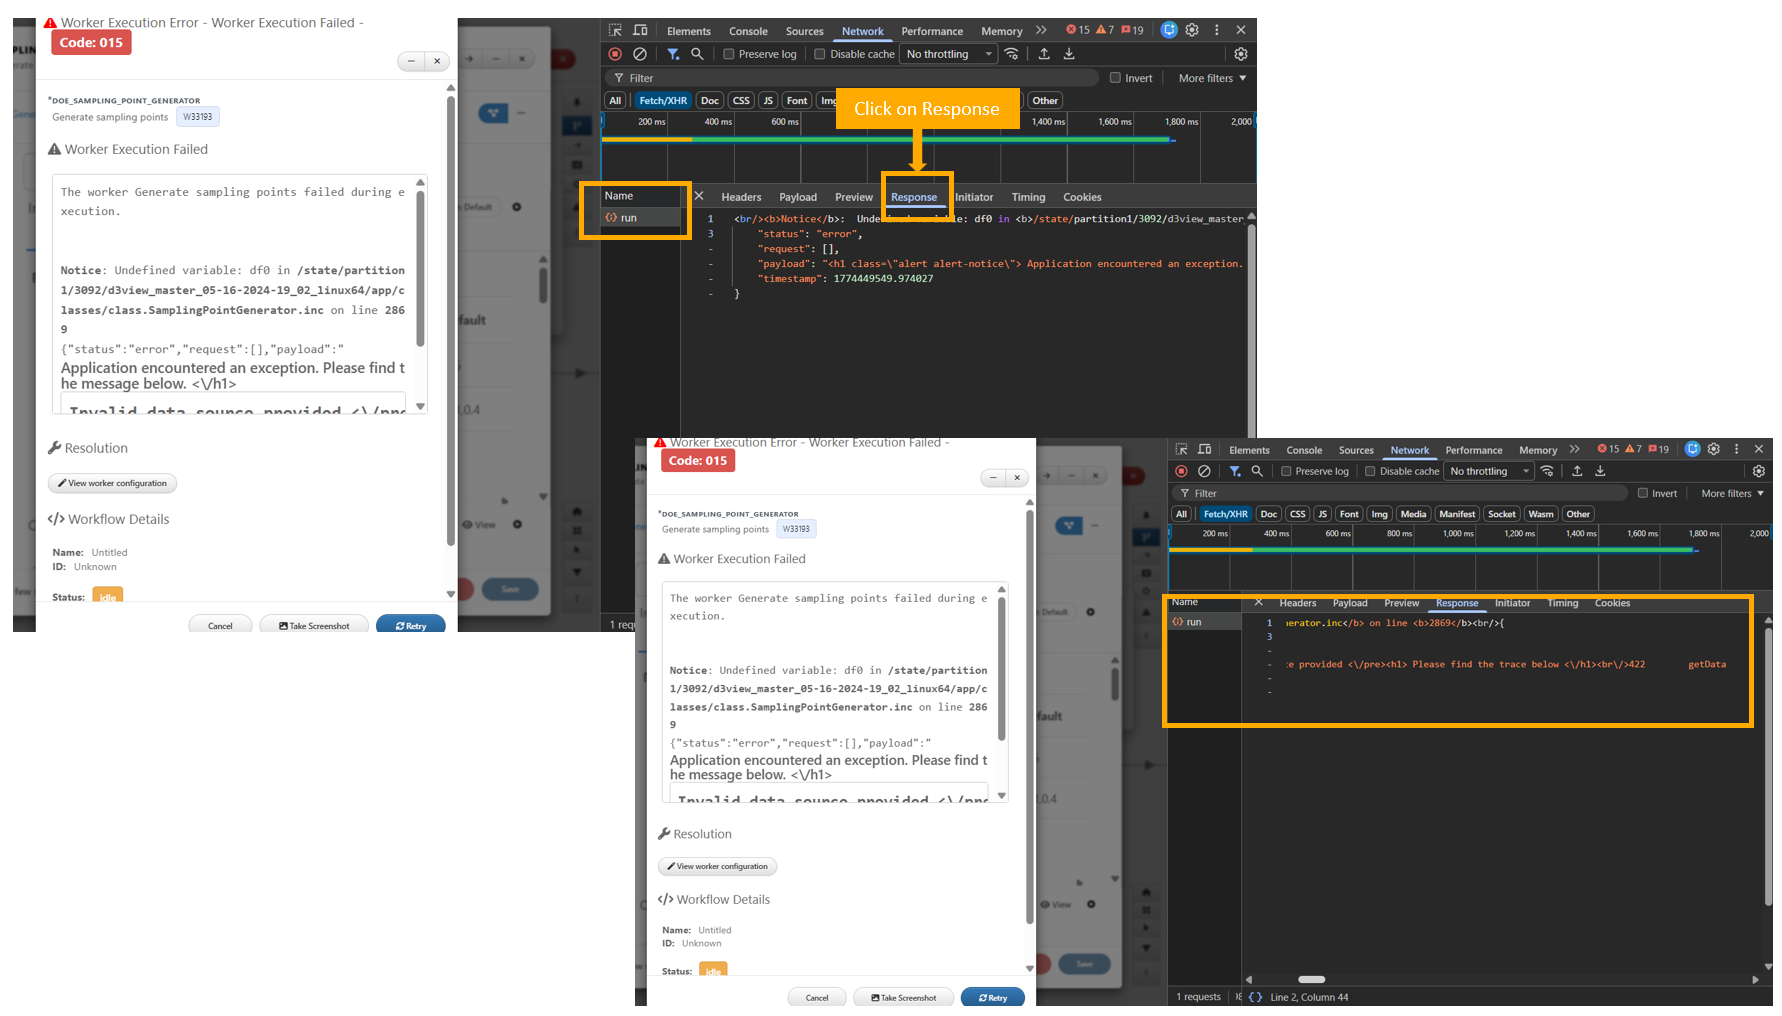
Network Response
34.5. Additional Details to Include
When reporting an issue, always include:
- Steps to reproduce
- Expected behavior
- Actual behavior
- Screenshots or screen recordings
- Browser and version
34.6. Conclusion
Following this structured approach ensures that developers receive all the necessary information to diagnose and resolve issues efficiently.